This post provides an introductory overview of how optimizing Asset Location can help investors reduce tax drags on their overall portfolio. We provide a simplified example to illustrate how a hypothetical high-earning couple in California with ~$1.7m in investable assets could save $6,370 in taxes through a more tax-efficient asset allocation between their taxable and tax-advantaged accounts.
Here are the assumptions for this example:
- John and Jane are a high-earning couple in their late-30s working and living in California
- They have a combined income this year of $832,000 putting them in the 37% Federal and 10.30% CA state tax brackets (assuming they will file Married, Filing Jointly). We’ll hold off on local taxes for this example.
- The couple have $790,000 spread across various Traditional IRA and 401k accounts and $915,000 in taxable investment accounts
- John and Jane know the basics of personal finance and hold a diversified 60/40 stock and bond allocation within each of their investment accounts (i.e. they have a 60/40 split in their 401k plans, a 60/40 split in their brokerage investments, etc.)
We’re going to spend the rest of this post examining how shifting assets across John and Jane’s various portfolios will help them reduce their overall tax drag. Instead of using a 60/40 allocation within each investment account they have against, we will look at all their investments in aggregate in order to determine a more tax-efficient strategy across their accounts.
To simplify this analysis we will:
- Focus just on the impact of taxes on the dividends or distributions from investments
- Treat all qualified accounts as one portfolio which we’ll called Tax-Advantaged Accounts and all taxable accounts as another portfolio which we’ll call Taxable Accounts
- Use a portfolio mix of 60% stocks represented by Vanguard’s S&P 500 Index (ticker: VOO) and 40% bonds represented by iShares’ Core US Aggregate Bond Index (ticker: AGG). While we don’t default to a 60/40 for our clients, it serves as an illustrative common reference point across examples we provide.
- Assume the same funds are available to an investor in both their Tax-Advantaged Accounts and their Taxable Accounts
Table 1: Yield and Tax Rates for High-Earning CA Couple For VOO and AGG
| Vanguard S&P 500 Index (VOO) | iShares Core US Aggregate Bond Index (AGG) | |
| 30 Day SEC Yield1 | 1.16% | 4.18% |
| Taxes on Yield: | ||
| Federal2 | 20.0% | 37.0% |
| State3 | 10.3% | 10.3% |
| NIIT4 | 3.8% | 3.8% |
| Effective Tax Rate | 34.1% | 51.1% |
1. As of August 31, 2025 for VOO and September 18, 2025 for AGG
2. Simplified assumption for this analysis that all VOO dividends are qualified while no distributions from AGG are qualified
3. CA levies flat 10.3% tax rate at this income level across all dividends and distributions
4. Assuming this couple will pay Net Investment Income Tax (NIIT) based on income
Optimizing Asset Location means taking into consideration two key traits of these assets that should be clear from the above:
- First, qualified dividends from stock index funds such as VOO are generally taxed at a lower Federal rate than distributions from bond funds. For John and Jane’s income level that means a 20.0% rate for qualified dividends and 37.0% rate for bond fund distributions.
- Second, the dividend yield of 1.16% on VOO is much lower than the 4.18% on AGG. In other words, there is less taxable income coming out VOO overall than AGG per dollar invested.
Our path to optimization is clear… move as much of the higher-taxed, higher-yielding asset into Tax-Advantaged Accounts (such as IRAs and 401k plans) while moving as much of the lower-taxed, lower-yielding asset into Taxable Accounts.
We’re going to assume John and Jane currently hold a 60% stock and 40% bond mix within each of their accounts which gives us the following split of assets and taxes between their Tax-Advantaged Accounts and their Taxable Accounts:
Table 2: Non-optimized, Consistent 60/40 Within Accounts:
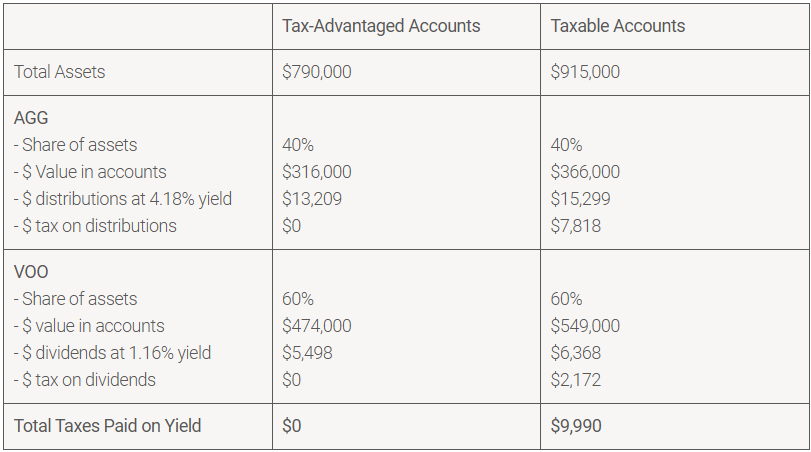
Distributing assets in a 60/40 split consistently within each of their accounts results in John and Jane paying ~$9,990 in taxes on the dividends and distributions they receive from their investments.
Now let’s look at what would happen if we optimize the portfolios for Asset Location by shifting as much of our bond mix into the Tax-Advantaged Accounts as we can while keeping the overall mix of stocks and bonds across accounts at 60/40. We’re making this shift because bonds both yield a higher income per dollar invested and are taxed at a higher rate than the stocks in our portfolio so we want to .
We now have the following results after redistributing assets across portfolios:
Table 3: Optimized, 60/40 Across Accounts
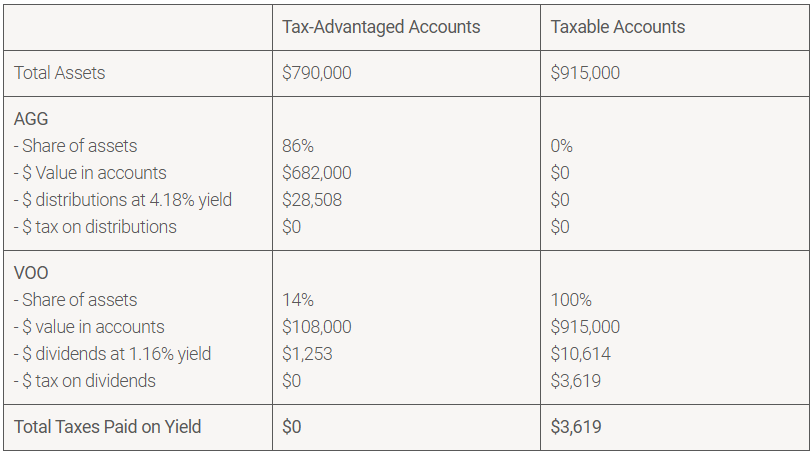
We’ve put all our bond holdings into the Tax-Advantaged Accounts boosting the share of bonds within those accounts to 86% (but keeping the total share of bonds across all accounts at 40%). We still have some stocks within our Tax-Advantaged Accounts, but our Taxable Accounts are now comprised 100% of lower yield, lower tax stocks. The total amount of pre-tax income we’re receiving from our investments in the form of dividends and distributions remains unchanged, but we’re keeping much more of the after-tax value of that income.
The net effect of this swap is a decrease in taxes paid on income from our investments from $9,989 a year down to $3,619. This is a decrease of $6,370 just by being a bit more intentional with how we approach allocating our assets across different types of accounts.
As we mentioned earlier, this is just a basic, illustrative example to show how more thoughtful asset location can benefit investors. In the real world, we would likely be doing this across a larger range of assets, account for the costs of reallocation, consider unique needs a client may have for a particular account, etc. Asset Location is also just part of our Systematic Enhancement approach to fully optimizing our clients’ investments.
Email us if you’d like to discuss anything in more detail or learn more about our services.
email: [email protected]
Disclosures:
This content is for educational purposes only and is not an investment recommendation. This is not tax or legal advice. We receive no direct compensation from any of the funds discussed. Employees and clients of Kangpan & Co. may hold investments discussed in this article. Speak with a licensed financial advisor before making any changes to your investments. Past performance is no guarantee of future returns. Investing involves risk including the loss of capital.
