Tag: playbooks

  • Portfolio Efficiency Diagnostic: Quantifying Hidden Tax, Fee, and Performance Drags

    This post details our approach to maximizing the after-tax and after-fee efficiency of a client’s investment portfolios using a Diagnostic. Check out our primer posts on Systematic Optimization  and  Diagnostics to learn more about our unique approach to financial advisory.

    Our Portfolio Efficiency Diagnostic examines opportunities to improve after-tax returns across your portfolio while also systematically looking for places to reduce overall fees and performance drags. Industry research shows the optimizations included in this Diagnostic could have a sizable impact on long-term portfolio returns through improvements such as:

    • Tax-Efficient Asset Location: which can result in 0.14 – 0.41% boosts to yearly after-tax returns according to Schwab
    • Tax-Loss Harvesting: that could lead to 1-2% a year in potential tax savings over 10 years according to JP Morgan
    • Fund Type Optimization: which could reduce fees by 0.51% a year, the average difference in fees between mutual funds and ETFs according to Morningstar

    As with all our Diagnostics, our structured approach ensures we are comprehensively examining your situation in a methodical way, quantifying the tradeoffs that matter, and then aligning your path forward to your unique goals. Our Diagnostics evolve over time as we identify additional analyses and Systematic Optimizations through our ongoing research and work with clients.

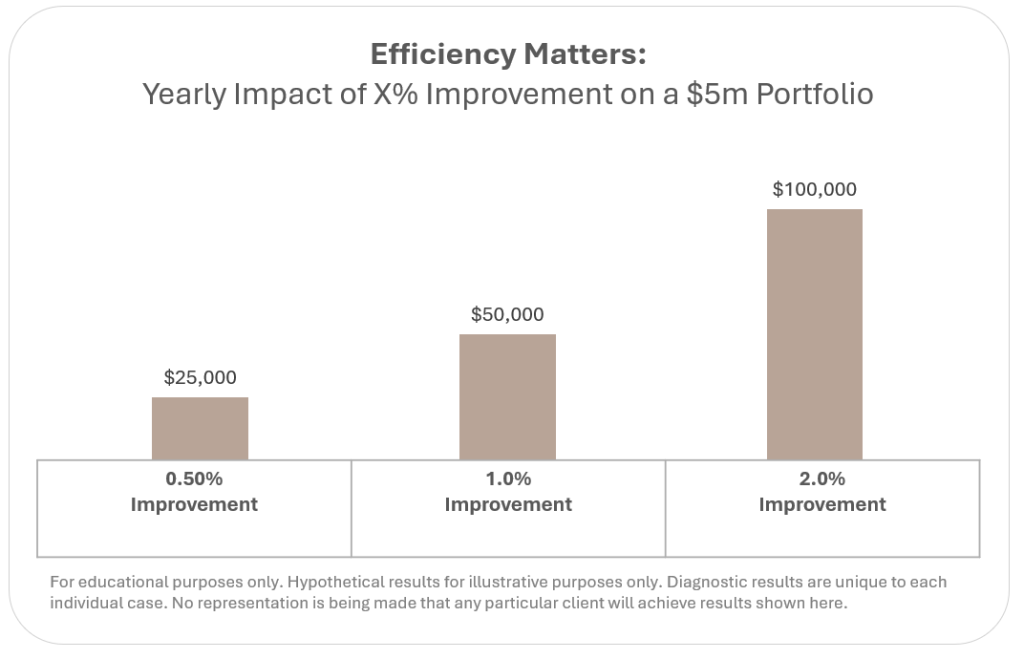
    Seemingly small efficiency improvements can have significant immediate and long-term impacts on a portfolio’s returns. As the chart below shows, just 0.50% improvement on a $5 million portfolio could result in $25,000 a year in additional after-tax wealth accruing to an investor.

    The Portfolio Efficiency Diagnostic

    Our Portfolio Efficiency Diagnostic currently contains ten primary Systematic Optimizations supported by dozens of detailed analyses as shown in the table below. All analyses and recommendations are provided to the client as part of our deliverable.

    Table 1: Our Portfolio Efficiency Diagnostic as of October 2025

    Systematic OptimizationsSupporting Analyses
    01: Minimize Index Fees– Identify index-tracking funds within portfolios
    – Compare expense ratios and fund fees vs. similar funds
    – Determine cost-savings opportunities from moving to lower fee alternatives
    See example
    02: Fund Type Optimization– Compare fully-loaded fees on any mutual funds being held with their ETF equivalents
    – Quantify cost impact of switching to lower fee alternatives
    02: Optimize Custodian Fees– Assess trading and brokerage fees across accounts
    – Calculate admin / custodial fees across accounts
    – Determine cost-savings from migrating accounts and providers
    03: Cash Yield– Calculate total cash holdings and corresponding after-tax yield
    – Compare after-tax yield of alternatives
    – Optimize cash positions across accounts to maximize after-tax yield
    See example
    04: Tax-Efficient Asset Location– Calculate current tax load on equity dividends and bond distributions across accounts
    – Determine potential tax efficiencies from moving higher yield and higher tax investments to tax-advantaged accounts
    See example
    05: Tax-Efficient Asset Types – Calculate current tax load on fixed income bond fund distributions across accounts
    – Compare potential tax efficiencies from moving to municipal and other tax-advantaged, fixed income instruments
    06: Tax-Loss / Tax-Gain Harvesting– Identify positions and lots with losses
    – Identify positions and lots with gains
    – Quantify opportunities for optimal tax-loss / tax-gain management
    – Determine opportunities for loss deductions and carryovers
    07: Asset Performance Benchmarks– Compare performance of individual, non-index funds to indexed equivalents
    – Understand performance optimization opportunities from moving to passive index equivalents
    08: Portfolio Performance Benchmarks– Compare performance of overall portfolio to common benchmarks i.e. 60/40 or our Core Portfolios to understand performance and risk optimization opportunities
    09: Account Types – Catalog current accounts and types (i.e. tax advantaged vs. brokerage, etc.)
    – Identify any gaps in account types that could improve after-tax results
    10: Contributions and Funding Strategies – Ensure funding and contribution strategies are maximizing after-tax results or aligned to long term goals (i.e. early retirement, withdrawal needs, etc.)

    Client Implementation

    This Diagnostic is available to our financial planning clients as part of their ongoing deep dives.

    If you’re not already a client, you might currently be paying for management and planning that is not delivering these systematic optimizations. The only way to stop the hidden drags in your portfolio is through an objective, rules-based audit.

    Our Portfolio Efficiency Diagnostic is available for a flat-fee engagement (typically $1,000 to $10,000), which is always priced to be significantly less than the expected quantifiable tax and fee savings we identify.

    Stop guessing about your hidden tax, fee, and performance drags and start executing an optimized playbook to address these issues. Email us to schedule a complimentary 30-minute Portfolio Efficiency Diagnostic Preview to learn more about what we could do for you.

    email: [email protected]

    Disclosures:
    This content is for educational purposes only and is not an investment recommendation. Employees and clients of Kangpan & Co. may hold positions in securities discussed in this post. Speak with a licensed financial advisor before making any changes to your investments. Past performance is no guarantee of future returns. Investing involves risk including the loss of capital.

  • Playbooks: Curated Strategies for Systematic Success

    This post is a brief primer on Playbooks, our unique approach to systematically delivering comprehensive analyses and recommendations for our clients.

    Given my engineering and technology background, we build most of our services and strategies on a modular basis via individual Systematic Optimizations. This allows us to become experts at optimizing the individual components of a client’s investment and financial strategy through a continuously evolving, methodical process. Our library of Systematic Optimizations grows alongside our firm over time so our clients will be able to experience compounding improvements to their financial lives with each year they work with us.

    A Playbook is a structured way to navigate and prioritize these optimizations based on a client’s goals or needs. Each Playbook is a curation of these individual optimization aligned to a specific theme (i.e. Portfolio Tax and Fee Efficiency Optimization) or to a particular client’s needs based on their customized financial plan.

    Here’s an example of a thematic Playbook:
    529 Plan Optimization Playbook

    These Playbooks, and the individual optimizations within each, are shared openly and transparently with our clients so they are always aware of what analyses we are doing, how we’ve arrived at our recommendations, and the impact we are having on their financial journey. The Playbooks also provide a clear prioritization for next steps for our advisors and their clients between meetings and help us track the cumulative improvements and optimizations we have made together.

    All Playbooks are available to our financial planning clients as part of their ongoing deep dives or can be purchased as a standalone, flat-fee project. Email us if you’d like to discuss anything in more detail or learn more about our Playbook-based approach to delivering continuously improving financial outcomes.

    email: [email protected]

    Disclosures:
    This content is for educational purposes only and is not an investment recommendation. Employees and clients of Kangpan & Co. may hold positions in securities discussed in this post. Speak with a licensed financial advisor before making any changes to your investments. Past performance is no guarantee of future returns. Investing involves risk including the loss of capital.

  • 529 Plan Diagnostic Details

    This post details our approach to optimizing a client’s college savings strategy using a Diagnostic. Check out our primer posts on Systematic Optimization and Diagnostics to learn more about our unique approach to financial advisory .

    It’s common to wonder whether you’re saving enough for your children’s educational needs and to also be unsure what the tradeoffs are to being underfunded vs. overfunded. Our 529 Plan Diagnostic is designed to quickly give clear answers to these and other common questions while enabling us to provide a comprehensive, tailored recommendation for improving your overall approach to college savings.

    As with all our Diagnostics, this structured approach ensures we are comprehensively examining your situation in a methodical way, quantifying the tradeoffs that matter, and then aligning your path forward to your unique goals. Our Diagnostics evolve over time as we identify additional analyses and Systematic Optimizations through our ongoing research and work with clients.

    Sample Analysis
    See what a deliverable looks like via a blinded detailed 529 analysis here.

    The 529 Diagnostic

    Our 529 Diagnostic currently contains five primary Systematic Optimizations supported by 12 detailed analyses as shown in the table below. All analyses and recommendations are provided to the client as part of our deliverable.

    Table 1: Our 529 Plan Optimization Diagnostic as of October 2025

    Systematic OptimizationsSupporting Analyses
    01: Optimize contribution strategy to reach target educational funding needs– Quantify the expected future cost of college
    – Model expected % of costs funded by plan based on current value of account(s) and contribution strategy
    – Calculate revised contribution strategy necessary to reach target funding %
    02: Define optimal investment allocation path to funding educational needs – Define target equity / bond mix by each investment year
    – Identify which funds to use within the specific 529 plan to implement the investment strategy
    03: Optimize 529 tax and funding benefits– Quantify the incremental tax benefits of using 529 plan to save for college costs
    – Balance tax benefits with potential costs of being overfunded and other opportunity costs
    04: Determine which state’s 529 plan is optimal– Calculate current plan costs vs. tax benefits
    – Compare against other state plans to identify opportunities for total cost improvements
    05: Develop mitigation strategy to minimize costs of being overfunded (if plan will be overfunded) – Quantify the incremental costs of being overfunded
    – Reduce costs through direct mitigation (i.e. Roth Rollover, Beneficiary Updates)
    – Further reduce costs through tax rate management

    Client Implementation

    This Diagnostic is available to our financial planning clients as part of their ongoing deep dives or can be purchased as a standalone, flat-fee project. Email us if you’d like to discuss anything in more detail or learn more about our services.

    email: [email protected]

    Disclosures:
    This content is for educational purposes only and is not an investment recommendation. Employees and clients of Kangpan & Co. may hold positions in securities discussed in this post. Speak with a licensed financial advisor before making any changes to your investments. Past performance is no guarantee of future returns. Investing involves risk including the loss of capital.